Gross Written Premium (GWP) – UK and Ireland
Growth observed across both markets, largely driven by pricing increases
Across the insurers analysed, premium growth is driven by a mix of pricing increases and membership growth, with pricing increases as the primary driver in most instances. Pricing increases reflect rising medical inflation driven by higher provider and drug costs. In Ireland, price increases are also driven by an ageing population, as highlighted by VHI Insurance, with community-rated premiums limiting the extent to which individual age risk can be reflected.
£6.87bn
UK Market GWP 2025 (+7.2% YoY)
€2.78bn
Ireland Market GWP 2025 (+6.5% YoY)
Scope of insurers with ≥90% Gross Written Premium (GWP) in the medical expense line of business:
| UK insurers |
|
|
| Irish Insurers |
|
|
| COUNTRY | INSURER | GWP 2025 [BN] |
GWP 2024 [BN] |
GROWTH (% YOY) |
REMARKS |
|---|---|---|---|---|---|
| UK | BINS | £3.79 | £3.54 | +7.1% | Customer growth and inflation-linked premium increases |
| AXA PPP | £2.01 | £1.95 | +3.1% | Pricing increases | |
| Vitality Health UK | £0.87 | £0.74 | +17.6% | Strong retention, new business growth and pricing increases implemented in 2024, earned in 2025 | |
| WPA | £0.20 | £0.18 | +11.1% | Customer growth (c. 5% across all business divisions) and higher premiums | |
| Ireland | VHI Insurance | €2.01 | €1.89 | +6.3% | Two price increases applied in the year and customer growth |
| Irish Life Health | €0.77 | €0.72 | +6.9% | Customer growth and higher average premiums |
“Insurance revenue increased by £341m due to growth in customer volumes and an increase in premium rates primarily to address medical costs inflationary pressures.”
- BINS SFCR 2025
“The earned premium net of reinsurance for VHI Insurance has increased year-on-year. This is primarily due to price increases across its health insurance plans in 2025 plus an increase of 13k in our PMI membership.”
- VHI Insurance SFCR 2025
“Gross written premium has increased by £66m to £2,013m, with higher prices being achieved on demand which has stabilized across both the UK market and our international partnerships.”
- AXA PPP SFCR 2025
“Premium income has been growing in recent years and has increased by 7% …due to growth in the number of customers and increases in average premium…where significant increases in medical costs necessitated price increases to maintain a sustainable margin.”
- ILH SFCR 2025
Combined Ratio –UK and Ireland (Loss ratio and expense ratio split)
Improving trend observed in underwriting margins
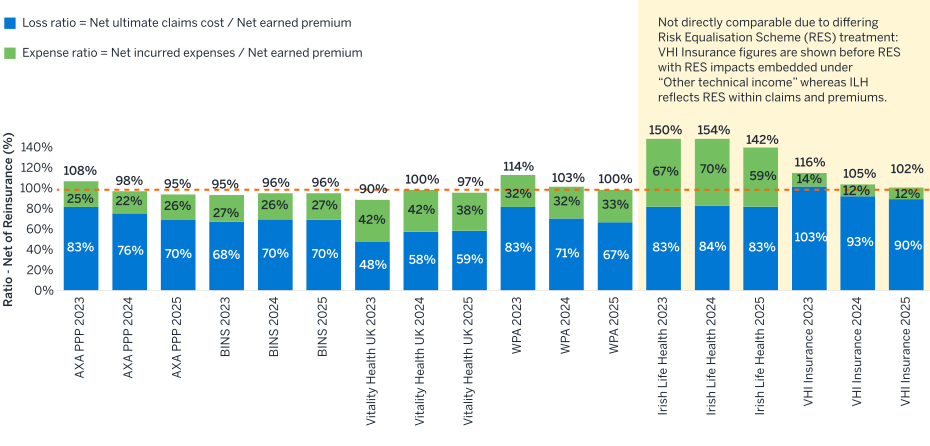
Loss ratio
- Claims pressures remain elevated, driven by higher utilisation and rising treatment costs.
- Frequency increased from earlier intervention and expanded access to care (e.g., digital/primary care) and longevity, whereas severity is driven by complex treatments and medical inflation.
- Performance improved across insurers in 2025 as a result of increased premiums, whereas Bupa’s performance remained stable.
Expense ratio
- Increasing spend on digital transformation and customer experience, with new-business growth adding upfront acquisition costs.
- ILH’s higher expense ratio reflects the impact of reinsurance, whereas VHI Insurance operates without reinsurance.
- For Vitality Health UK, absolute expenses increased from 2024 level driven by acquisition costs; however, the expense ratio improved due to a much higher rise in net earned premiums.
“In 2025, VHI saw private hospital claims increase by approximately 13%, accompanied by an 8% uplift in volume relative to 2024, reflecting higher healthcare utilisationand the growing cost of delivering care. Cost pressures across the healthcare sector continue to be influenced by persistent medical inflation, demographic changes associated with an ageing population, and the introduction of new drugs, technologies, and clinical procedures.”
- VHI Insurance SFCR 2025
“The performance of the Company was a profit on ordinary activities before tax of £107m (2024: £34m profit) with action on pricing and claims management growing the profitability of the insurance service result.”
- AXA SFCR 2025
Solvency Coverage Ratio – Insurer level
Solvency capital positions reflect strong capital generation and growth
Solvency coverage ratios have improved or remained stable, driven by strong capital generation from underwriting profits and investment returns, offset by increases in capital requirements due to business growth and increased underwriting risk.
178%
UK weighted average 2025 (+6 ppts)
175%
Ireland weighted average 2025 (+3 ppts)
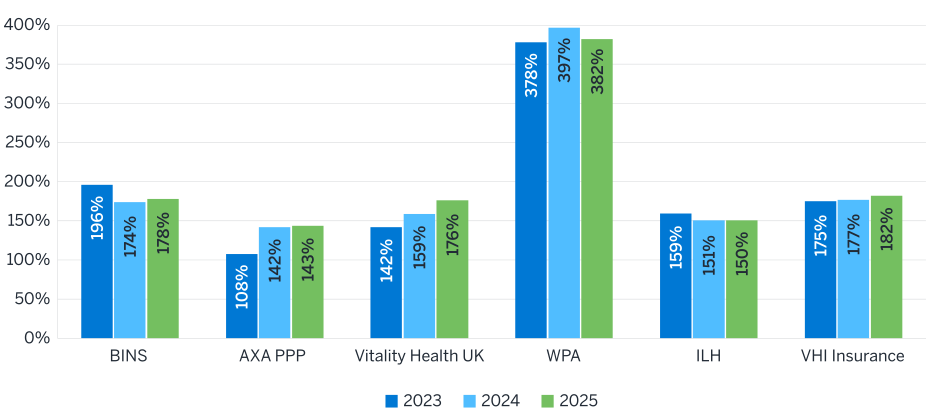
UK MARKET
UK insurers’ solvency coverage ratios reflect a balance between capital generation, business growth and dividend distributions.
Eligible Own Funds (EOF):
- Increased due to underwriting profits, retained earnings and positive investment performance, supported by easing inflation and favourablereturn on fixed deposits in a declining interest rate environment.
- Offset by capital distributions through dividends (e.g., £122m in dividend payments in 2025 for BINS).
SCR:
- Increased primarily due to higher underwriting exposure from business growth, increase in lapse risk and premium/reserve volume measure.
IRISH MARKET
Ireland insurers’ solvency coverage ratios reflect movements in capital and changes in risk exposure.
- EOF: Increased due to underwriting and investment performance, offset by capital distribution through dividends (e.g., €22m in 2025 for ILH).
- SCR: Driven by underlying risk exposure across underwriting, market, credit and operational risks.
SCR risk breakdown – Market
Health underwriting risk dominates, whilst diversification and Loss Absorbing Capacity of Deferred Tax (LACDT) provide capital relief
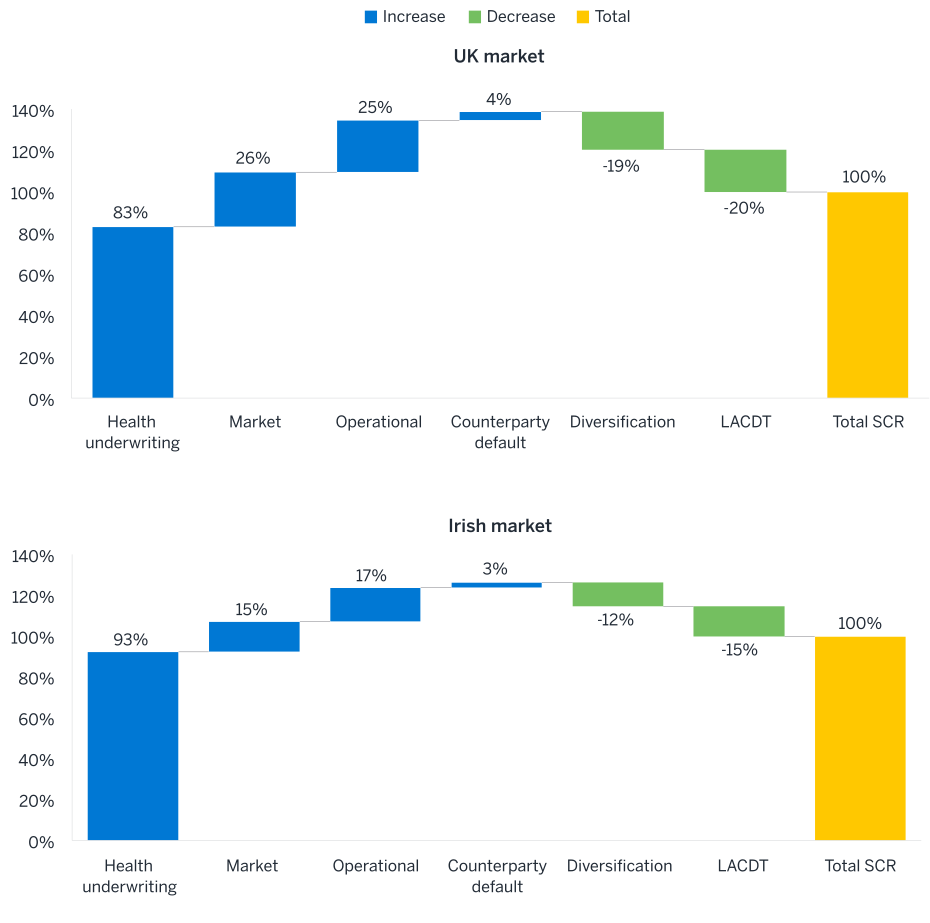
HEALTH UNDERWRITING RISK
- Largest SCR component
- Driven by premium risk, claims volatility, business growth and rising healthcare costs (e.g., medical inflation, utilisation and demographics)
- Reserving risk remains limited due to short-tail claims
- Insurers (BINS and Vitality Health UK) using Undertaking Specific Parameters (USPs) to better align the capital requirement to their underwriting risk profile than the Standard Formula (SF)
MARKET RISK
- Secondary contributor to SCR
- Reflects exposure to investment assets, primarily bonds and short-term instruments
- Bonds and Collective Investment Undertakings (CIUs) dominate (>75% of total holdings in 2025), with the balance largely in cash, cash equivalents and short-term instruments held for liquidity
OPERATIONAL RISK
- Material component driven by operational complexity, outsourcing, IT/cyber risk and regulatory requirements
COUNTERPARTY DEFAULT
- Smallest risk component driven by reinsurance recoverables and counterparty exposures
LACDT
- Provides the potential to reduce the SCR by taking into account the tax relief arising from the future losses under stresses. Among the insurers analysed, only WPA and AXA PPP do not take credit for LACDT.
DIVERSIFICATION
- Reduces total SCR through correlation benefits across risk modules
“Underwriting risk has increased primarily driven by higher plan premiums and an increase in the USP used in the calculation.”
- BINS SFCR 2025
“Health underwriting risk and market risk are the biggest contributors to the level of solvency capital required to be held by Vhi Insurance…One of Vhi’s main health underwriting risks is pricing risk…other significant factors affecting underwriting risk are our business mix, claims volatility and reserving risk.”
- VHI Insurance SFCR 2025
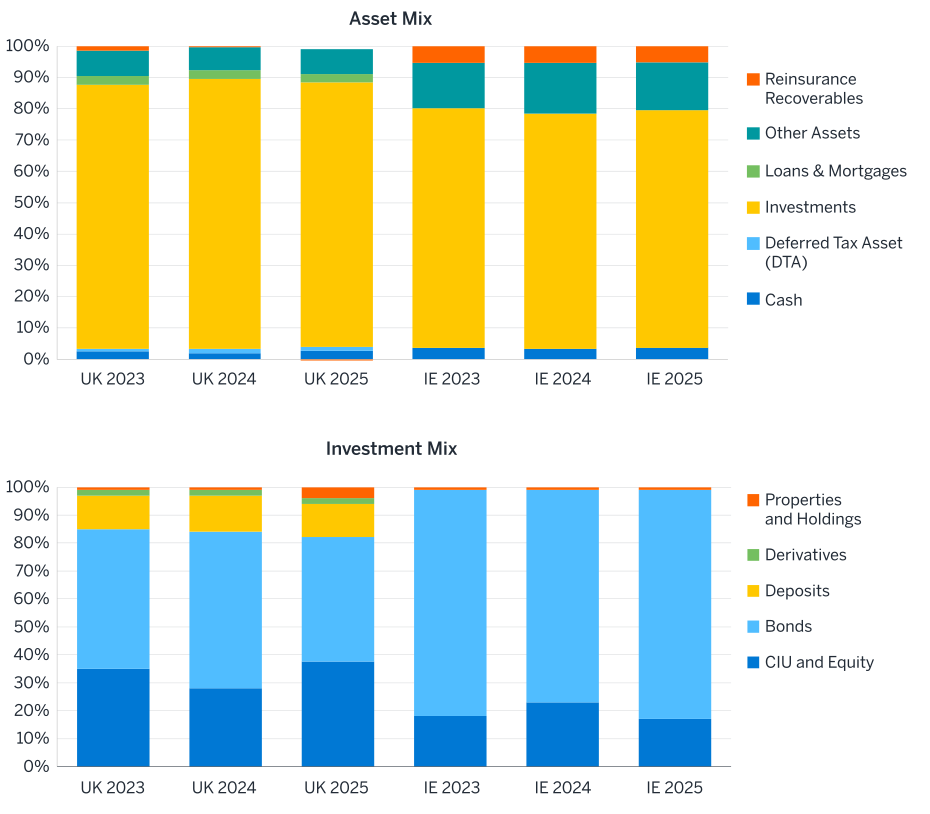
Assets and investments – UK and Ireland
Investment-led asset mix, concentrated in Collective Investment Undertaking (CIU) funds and bonds supporting liquidity needs
- Investments dominate asset mix across UK and Ireland, primarily backing technical provisions with fixed income and liquid instruments.
- Asset strategies are conservative, with a focus on capital adequacy and liquidity.
- Reinsurance recoverables are significantly higher for Irish insurers (~5% of assets, stable over 2023–2025), whilst UK levels are minimal and turn slightly negative in 2025, driven by negative recoverables on technical provisions (notably for AXA and Bupa via use of internal reinsurance arrangements). All insurers analysed utilise reinsurance (except VHI Insurance), primarily through quota share and excess-of-loss structures.
- Insurers in both markets hold predominantly liquid investment portfolios, concentrated in bonds and CIU and Equity, with limited exposure to other assets. Ireland is more bond-heavy, whereas the UK is more diversified with higher CIU and Equity and deposits.
- This is consistent with the relatively short-tail nature of claims liabilities and supports a preference for assets that can be realised readily to meet claims liabilities.
- Within CIU and Equity, ~5% is Equity, with the remainder in CIU; underlying CIU asset mix is not disclosed in SFCRs.
Key risk themes by frequency and severity - UK & Ireland
Key risk themes
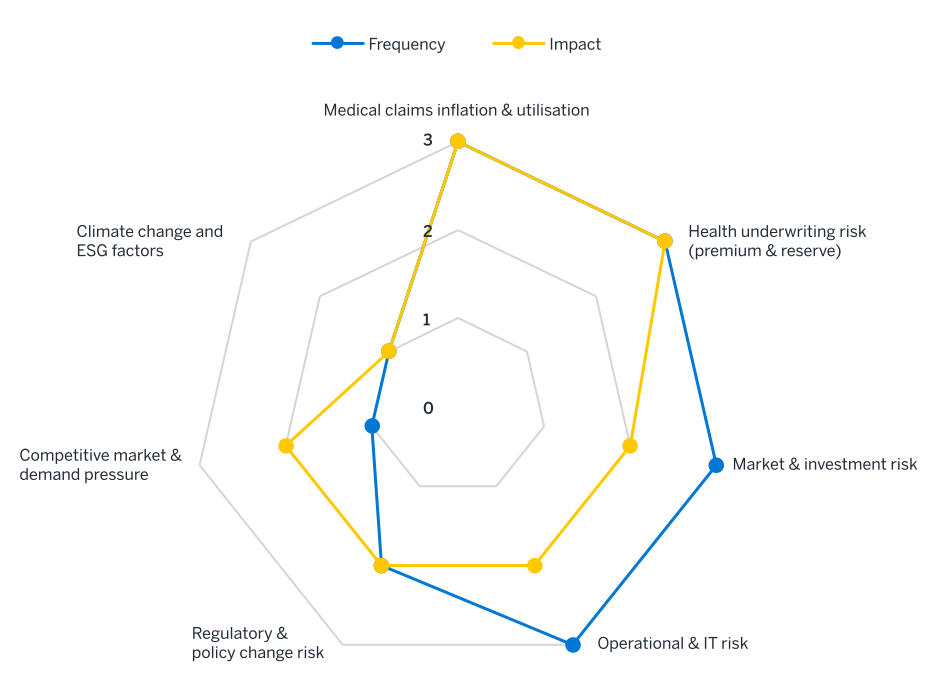
Risk themes were identified, assessed and categorisedby risk type; they were then scored based on (i) prevalence in terms of perceived frequency and (ii) evidence of financial or capital impact (e.g., SCR and claims drivers). The analysis shows that claims cost is the primary risk driver underpinning both capital requirements and strategic focus.
Key risk themes identified across PMI insurers
| RISK THEME | SCORE | COMMENTARY |
|---|---|---|
| Medical claims inflation and utilisation | High frequency and high impact | Consistently cited by all insurers and is a primary driver of underwriting risk SCR (largest component). High positive correlation between frequency and severity, as the risk directly drives claims liabilities (largest liability component). |
| Health underwriting risk | High frequency and high impact | Consistently cited by all insurers and is the largest SCR module; high positive correlation between frequency and severity as pricing and claims uncertainties translate into underwriting risk volatility. |
| Market and investment / Operational & IT risk | High frequency and moderate impact | Widely cited by all insurers, reflecting exposure to market movements and operational risks; however, it contributes less than underwriting risk as most insurers adopted low-risk investment strategies. |
| Regulatory and policy change risk | Moderate frequency and moderate impact | Regularly cited by insurers, particularly in evolving regulatory environments; however, full exposure is not necessarily captured within the Pillar 1 SCR, hence, it is assessed more holistically under Pillar II, i.e., Own Risk and Solvency Assessment (ORSA). |
| Competitive market & demand pressure | Low frequency and moderate impact | Limited mention by insurers as it sits outside the core solvency reporting; however, it affects pricing, volumes and margins, with indirect impact on SCR. |
| Climate change and Environmental, Social and Governance (ESG) factors | Low frequency and low impact | Limited and emerging mentions by insurers and impact is low, as they are not included. |
Note: Definitions of risk categories are provided in the Appendix.
Market outlook -UK and Ireland
Forward-looking themes for UK & Ireland PMI insurers
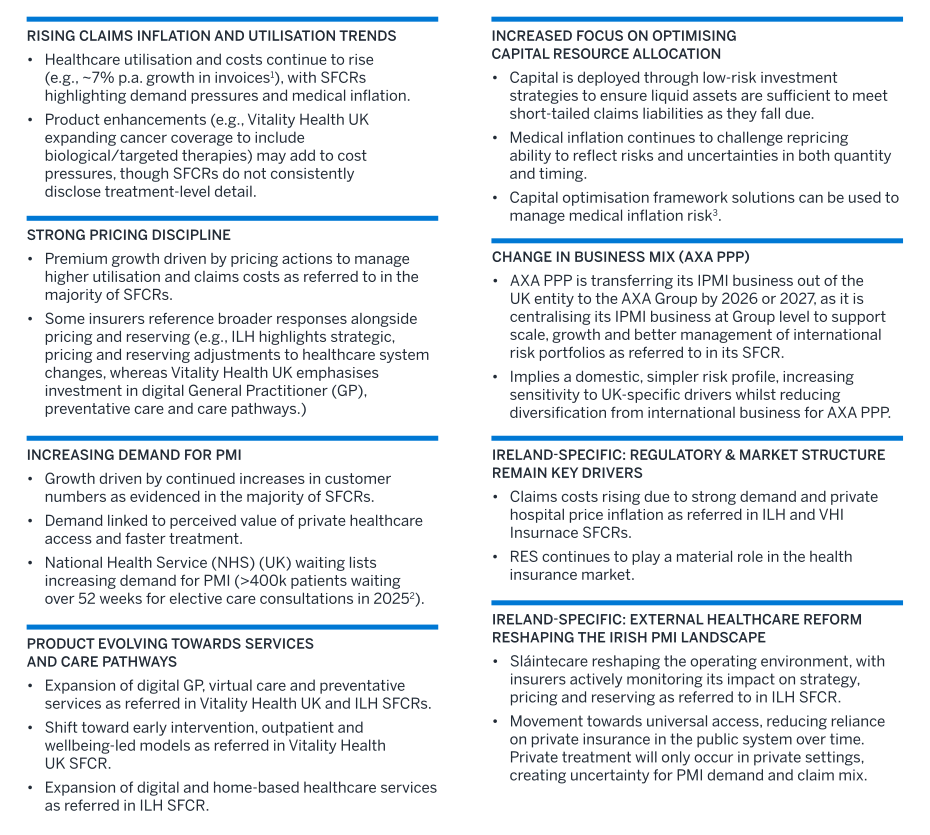
Based on our review and analysis of PMI insurers’ SFCRs, we have identified key risks and uncertainties, as well as emerging trends. Where possible, we have indicated which observations are sourced from relevant SFCRs, supplemented by our thought leadership and external resources.
1 Healthcode. (2026, April 27). HealthcodeQ1 data: Record breaking start to the year for private healthcare. Retrieved July 1, 2026, from https://www.healthcode.co.uk/news/healthcode-q1-data-record-breaking-start-to-the-year-for-private-healthcare/.
2 NHS England. (2025, January 9). Reforming elective care for patients. Retrieved July 1, 2026, from https://www.england.nhs.uk/long-read/reforming-elective-care-for-patients/.
3 Fairall, C. (2026, January 27). Capital optimisationfor health insurers. Milliman. Retrieved July 1, 2026, from https://uk.milliman.com/en-GB/insight/capital-optimisation-framework-health-insurers.
Appendix
Key risks for PMI insurers
Detailed breakdown of each risk theme from SFCR risk sections to be used alongside the radar chart on Slide 8. Each theme shows its market.
| RISK THEME | RISK COMPONENTS | UK MARKET | IRISH MARKET |
|---|---|---|---|
| Medical claims inflation and utilisation |
Rising healthcare and treatment costs | ✓ | ✓ |
| Higher claims volumes and utilisation | ✓ | ✓ | |
| Ageing demographics increasing utilisation | ✗ | ✓ | |
| Health underwriting risk (premium and reserve) | Uncertainty in pricing future claims | ✓ | ✓ |
| Reserve adequacy risk on incurred claims | ✓ | ✓ | |
| Premium risk higher than reserve risk | ✓ | ✓ | |
| Market and investment risk | Investment exposure to market volatility | ✓ | ✓ |
| Risks from interest rates and bond spreads | ✓ | ✓ | |
| Equity, property and currency fluctuations | ✓ | ✓ | |
| Operational and IT risk | Operational and system disruption risks | ✓ | ✓ |
| IT outages and business interruptions | ✓ | ✓ | |
| Data security and cyber breach exposure | ✓ | ✓ | |
| Outsourcing and third-party service risks | ✓ | ✓ | |
| Regulatory and policy change risk |
Consumer protection frameworks | ✓ | ✓ |
| Solvency II and UK regulatory developments, NHS reforms affecting PMI demand | ✓ | ✗ | |
| Sláintecare reforms impacting PMI demand | ✗ | ✓ | |
| Risk equalisation and compliance pressures | ✗ | ✓ | |
| Competitive market and demand pressure |
Pricing pressure from rivals and new entrants | ✓ | ✓ |
| Macroeconomic impacts on affordability and demand | ✓ | ✓ | |
| Economic downturns affect supply chain | ✓ | ✓ | |
| Climate change and ESG factors |
Climate and sustainability-related risks | ✓ | ✓ |
| Growing ESG and regulatory compliance expectations | ✓ | ✓ | |
| Net-zero and sustainability commitments emerging | ✓ | ✓ |
Caveats, limitations and use
The observations presented in this briefing are based on publicly disclosed SFCRs and QRTs and should be read alongside the below-mentioned caveats.
- The purpose of this briefing is to provide insights into the year-end 2025 Solvency and Financial Condition Reports (SFCRs) of selected health insurers underwriting medical insurance business in the UK and Ireland.
- The analysis is based on data sourced from public SFCRs and Quantitative Reporting Templates (QRTs).This underlying data has not been audited or verified; therefore, if the original source information is inaccurate, the results of this analysis may also be inaccurate.
- We have included insurers that are Solvency II-regulated and categorisedas solo non-life/composite entities with at least 90% of GWP coming from medical expense or PMI business. Where solo entities are part of Solvency II-regulated group undertakings, we ensure there is no double-counting by only including their solo entities’ SFCRs and related data.
- We exclude companies with business that falls within ring-fenced funds, which restrict Own Funds to the total Solvency Capital Requirement (SCR) value (e.g., Exeter Friendly Society in the UK). We exclude insurers that sell high volumes of products in other lines of business, such as motor insurance or property and casualty (P&C) insurance (e.g., Aviva in the UK), because it is not possible to isolate the capital charges for the PMI or Medical Expense line of business alone based on the information included in the QRTs. This rule was applied as a first-pass filter to remove a large number of companies that are not predominantly health insurers.
- The analysis is based on a selected sample of insurers and is not representative of the broader market.
- The information provided in this briefing represents the opinions of the authors and is not representative of the views of Milliman, Inc.
- This briefing is for informational purposes only and does not constitute actuarial, financial, or investment advice. The information provided should only be used in conjunction with professional advice after the recipient has performed an independent review of its accuracy.
- The information contained herein is current only as of the date of this briefing and may be subject to change without notice.
- Any references to third-party websites are provided for reference purpose only.
- Throughout the deck, the text presented in boxes reflects direct quotations from SFCRs. All other text represents our interpretation based on SFCR content, which is often distributed across multiple sections and not always explicitly stated in a single location, unless otherwise indicated.